Chi-square/Fisher’s
Exact Test
Independence Testing
A test of
independence is a statistical test that determines whether two categorical
variables associate with each other. Chi-square test and Fisher’s exact test,
which apply to contingency tables, are common approaches of independence
testing.
Fisher’s exact test is
one of the exact tests, while chi-square test is based on approximation. When
there are more than 20% of cells with < 5 expected frequencies,
Fisher’s exact test is preferrable to chi-square test because applying
approximation is inadequate.
If the corresponding
p-value of the test statistic is less than the chosen significance level, then
the association between the two variables is statistically significant.
Chi-square Test
Chi-square test is a
non-parametric statistical hypothesis test. The null hypothesis is that the
observed frequency is consistent with the expected frequency of certain events
in a sample. If the frequency distribution of a categorical variable does not
differ across groups from another categorical variable, the two variables can
be concluded as independent.
The test statistic is:
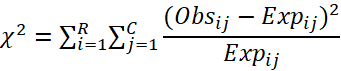
Following ![]() distribution
with degrees of freedom
distribution
with degrees of freedom ![]() and where
and where ![]() is the observed frequency,
is the observed frequency, ![]() is the expected
count,
is the expected
count, ![]() is the number
of rows of table and
is the number
of rows of table and ![]() is the number
of columns.
is the number
of columns.
Fisher’s Exact Test
Fisher’s Exact Test
is based on a hypergeometric distribution of the counts in cells of the
contingency table. A 2 x 2 contingency table is shown below:
|
|
A |
Not A |
Total |
|
B |
|
|
|
|
Not B |
|
|
|
|
Total |
|
|
|
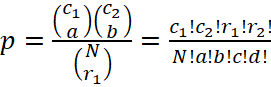
The probability of
obtaining such frequency distribution is:
Some statistical
analysis software and packages, for example, SAS, supports Fisher’s exact test
on general ![]() x
x ![]() tables.
tables.
Example Code in SAS
DATA PERSONS ; INPUT
GROUP $ SUCCESS $ @@;
DATALINES ;
DRUG NO DRUG NO DRUG NO DRUG YES
DRUG YES DRUG YES DRUG YES DRUG YES
DRUG YES DRUG YES
PLACEBO NO PLACEBO NO PLACEBO YES
PLACEBO YES
PLACEBO YES PLACEBO YES PLACEBO YES
PLACEBO YES
PLACEBO YES PLACEBO YES
RUN ;
PROC FREQ DATA = PERSONS ;
TABLES GROUP * SUCCESS/ NOPERCENT NOCOL
NOROW
CHISQ FISHER EXPECTED
;
RUN ;
Example Code in R
i# input data
success <- c("No", "No", "No", "Yes", "Yes", "Yes", "Yes", "Yes", "Yes", "Yes",
"No", "No", "Yes", "Yes", "Yes", "Yes", "Yes", "Yes", "Yes", "Yes")
group <- c("drug", "drug", "drug", "drug", "drug", "drug", "drug", "drug",
"drug", "drug", "placebo", "placebo", "placebo", "placebo",
"placebo", "placebo", "placebo", "placebo", "placebo", "placebo")
# create
a dataframe
df <- data.frame(success, group)
# contingency
table
table(df)
# compute
expected frequencies on the contingency table
xsq <- chisq.test(df$success, df$group)
xsq$expected
# 50% of cells have expected
counts less than 5. Use fisher's exact test
fisher.test(df$success, df$group)
References
1. Kim
H. Y. (2017). Statistical notes for clinical researchers: Chi-squared test and
Fisher's exact test. Restorative dentistry & endodontics, 42(2), 152–155. https://doi.org/10.5395/rde.2017.42.2.152
2. Hoffman,
J. I. E. (2015). Biostatistics for Medical and Biomedical Practitioners.
Academia Press. https://doi.org/10.1016/B978-0-12-802387-7.00013-5