Confusion Matrix
A confusion matrix, also known as an error
matrix, is a specific table layout that allows visualization of the performance
of an algorithm. It is a special kind of contingency table, with two dimensions
("actual" and "predicted"), and identical sets of
"classes" in both dimensions (each combination of dimension and class
is a variable in the contingency table).
The Layout of the confusion matrix is as follow:
|
|
|
Predicted
Condition |
|
|
|
Total
population = P + N |
Positive (PP) |
Negative (PN) |
|
Actual
condition |
Positive (P) |
True Positive
(TP) |
False
Negative (FN) |
|
Negative (N) |
False
Positive (FP) |
True Negative
(TN) |
|
1.
True Positive (TP): A test result
that correctly indicates the presence of a condition or characteristic.
2.
True Negative (TN): A test result
that correctly indicates the absence of a condition or characteristic.
3.
False Positive (FP): A test result
which wrongly indicates that a particular condition or attribute is present.
4.
False Negative (FN): A test result
which wrongly indicates that a particular condition or attribute is absent.
Terms Used
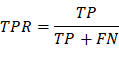
TPR/Sensitivity: True positive rate, measures the
proportion of positives that are correctly identified(correctly
identify those with a disease).
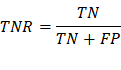
TNR/Specificity: True negative rate,
measures the proportion of negatives
that are correctly identified (correctly identify
those without a disease).
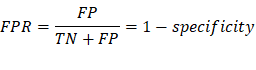
FPR/Type I Error: False positive
rate, measures the proportion of negatives that are wrongly categorized as positives.
(The probability of rejecting the null hypothesis when it’s true)
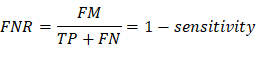
FNR/Type II Error: False negative
rate, measures the proportion of positives that are wrongly categorized as
negatives. (The probability of accepting the null hypothesis when it’s false)
R Example
#Install required packages
install.packages('caret')
#Import required library
library(caret)
#Creates vectors having data
points
expected_value <- factor(c(1,0,1,0,1,1,1,0,0,1))
predicted_value <- factor(c(1,0,0,1,1,1,0,0,0,1))
#Creating confusion matrix
example <- confusionMatrix(data=predicted_value, reference = expected_value)
#Display results
example
#Simpler way
table(expected_value,predicted_value)
SAS Example
data predicts;
input expect predict;
datalines;
1 1
0 0
1 0
0 1
1 1
1 1
1 0
0 0
0 0
1 1
;
proc freq data=predicts;
tables expect*predict;
run;