Correlation
Definition
Correlation refers to the extent to
which two variables are linearly related. It describes the statistical relationship
between two variables without implying causation.
Correlation is measured by correlation
coefficients, which vary from -1.0 to +1.0. A correlation coefficient with
value greater than zero indicates a positive correlation, where the values of
two variables move in the same direction. On the contrary, a negative
coefficient implies a negative correlation, where the value of one variable decreases while the value of the other variable increases.
Common measures
The most common measure is the Pearson’s
correlation coefficient, denoted as ![]() when applied to a population, which indicates
the distance between actual observations and the expected values. It is calculated as the covariance of the two
variables divided by the product of their standard deviations:
when applied to a population, which indicates
the distance between actual observations and the expected values. It is calculated as the covariance of the two
variables divided by the product of their standard deviations:
![]()
, where ![]() is the covariance between variables
is the covariance between variables ![]() and
and ![]() ,
, ![]() and
and ![]() are their standard deviations.
are their standard deviations.
Given a sample data, ![]() can be estimated by
can be estimated by ![]() :
:
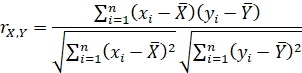
, where ![]() are observed values in the data,
are observed values in the data, ![]() and
and ![]() are the sample means,
are the sample means, ![]() is the sample size.
is the sample size.
Example Code in SAS
data Setosa;
input SepalLength SepalWidth PetalLength PetalWidth @@;
label sepallength='Sepal Length in mm.'
sepalwidth='Sepal
Width in mm.'
petallength='Petal
Length in mm.'
petalwidth='Petal
Width in mm.';
datalines;
50 33 14 02 46 34 14 03 46 36 .
02
51 33 17 05 55 35 13 02 48 31 16 02
52 34 14 02 49 36 14 01 44 32 13 02
50 35 16 06 44 30 13 02 47 32 16 02
48 30 14 03 51 38 16 02 48 34 19 02
50 30 16 02 50 32 12 02 43 30 11 .
58 40 12 02 51 38 19 04 49 30 14 02
51 35 14 02 50 34 16 04 46 32 14 02
57 44 15 04 50 36 14 02 54 34 15 04
52 41 15 . 55 42 14 02 49 31 15 02
54 39 17 04 50 34 15 02 44 29 14 02
47 32 13 02 46 31 15 02 51 34 15 02
50 35 13 03 49 31 15 01 54 37 15 02
54 39 13 04 51 35 14 03 48 34 16 02
48 30 14 01 45 23 13 03 57 38 17 03
51 38 15 03 54 34 17 02 51 37 15 04
52 35 15 02 53 37 15 02
;
PROC CORR
data = Setosa;
VAR speallength petallength;
RUN;
Example Code in R
# input data
sepal_length
<- c(50, 46,
46, 51, 55,
48, 52, 49,
44, 50, 44,
47, 48, 51,
48,
50,
43, 58, 51,
49, 51, 50,
46, 57, 50,
54, 52, 55,
49, 54,
50,
44, 57, 46,
51, 50, 49,
54, 54, 51,
48, 48, 45,
57, 51,
54,
51, 52, 53,
55)
sepal_width
<- c(33, 34,
36, 33, 35,
31, 34, 36,
32, 35, 30,
32, 30, 38,
34,
30,
32, 30, 40,
38, 30, 35,
34, 32,
55, 36, 34,
41, 42, 31,
39,
34, 29, 32,
31, 34, 35,
31, 37, 39,
35, 34, 30,
23, 38,
38,
34, 37, 35,
37)
petal_length
<- c(14, 14,
NA, 17, 13,
16, 14, 14,
13, 16, 13,
16, 14, 16,
19,
16,
12, 11, 12,
19, 14, 14,
16, 14, 15,
14, 15, 15,
14, 15,
17,
15, 14, 13,
15, 15, 13,
15, 15, 13,
14, 16, 14,
13, 17,
15,
17, 15, 15,
15)
petal_width
<- c(02, 03,
02, 05, 02,
02, 02, 01,
02, 06, 02,
02, 03, 02,
02,
02,
02, NA, 02,
04, 02, 02,
04, 02, 04,
02, 04, NA,
02, 02,
04,
02, 02, 02,
02, 02, 03,
01, 02, 04,
03, 02, 01,
03, 03,
03,
02, 04, 02,
02)
# create a data frame
df
<- data.frame(sepal_length, sepal_width, petal_length, petal_width)
# output the correlation matrix
cor(df, method="pearson")
Reference
1.
Croxton,
Frederick Emory; Cowden, Dudley Johnstone; Klein, Sidney (1968) Applied General
Statistics, Pitman. ISBN 9780273403159 (page 625)
2.
Dietrich, Cornelius
Frank (1991) Uncertainty,
Calibration and Probability: The Statistics of Scientific and Industrial
Measurement 2nd
Edition, A. Higler.
ISBN 9780750300605 (Page 331)
3.
Aitken, Alexander Craig
(1957) Statistical Mathematics 8th Edition. Oliver & Boyd. ISBN
9780050013007 (Page 95)
4.
SAS
Help Center. (2021). The CORR Procedure.
https://documentation.sas.com/doc/en/pgmsascdc/v_010/procstat/procstat_corr_examples02.htm